Open calculation
How the rainwater tank calculator works
The planner is deterministic: the same daily rainfall and inputs produce the same result. No language model selects the tank or alters the calculation.
For a step-by-step application of this method, use the rainwater tank sizing guide. To prepare the inputs, check roof yield and water demand and daily rainfall quality.
1. Daily harvest
In metric units, one millimetre of rain falling on one square metre equals one litre before losses. The connected catchment should be the horizontal roof footprint draining to the tank—not the sloped surface area.
Daily harvest (L) = rainfall (mm) × connected roof footprint (m²) × collection efficiency
Collection efficiency represents first-flush diversion, filters, leaks, splash, wind, and other losses as one explicit factor. The U.S. Department of Energy technology review cites 75%–90% as a common range, depending on the system. It is a starting assumption, not a substitute for measured performance.
2. Daily tank balance
The rainfall series must have one valid observation for every calendar day between its first and last date. Missing dates or rainfall values are rejected, not treated as dry days. Explicit zero rainfall is allowed. This preserves the elapsed dry days and water demand when the model carries storage from one day to the next.
For every tested tank, the model processes each calendar day in this order:
- Add the day's harvest to the previous storage.
- Record water above tank capacity as overflow.
- Supply as much of the stated daily demand as remains available.
- Carry the ending storage into the next day.
This is a yield-after-spill model. Real rainfall, use, pumps, dead storage, pipe capacity, multiple tanks, evaporation, maintenance, and intra-day timing can differ. The current model assumes one catchment, one effective tank, no mains top-up, and no water-quality decay.
Water use is constant within each selected month. By default, all months use the daily amount you entered. With seasonal use enabled, unselected months have zero demand, while rainfall continues to fill the tank. This does not model individual watering days, weekday-only schedules, or changes in demand within a month.
3. Compared outcomes
| Measure | Definition |
|---|---|
| Demand covered | Total modeled litres supplied ÷ total stated demand. |
| Water-use days fully supplied | Days on which the tank could supply the entire stated daily demand ÷ days with positive water use. Months with no water use are excluded from both counts. |
| Annual supplied water | Total supplied water divided by modeled days and annualized with 365.2425 days per year. |
| Overflow | Water that could not fit after daily inflow, annualized across the source period. |
| Longest shortfall | Longest consecutive sequence with any unmet stated demand. |
4. Why a tank size is highlighted
The highlighted result is the smallest capacity you tested whose demand coverage is within two percentage points of the highest coverage among those capacities. This rule helps expose diminishing modeled benefit; it is not an engineering optimum or purchase recommendation. Change the tested sizes to inspect the curve.
Automatic water-use sensitivity
Each calculation returns three cases using the same rainfall record and tested tank capacities: low water use at 75% of the entered amount, normal at 100%, and high at 125%. A seasonal or monthly profile is multiplied by the same factor in every month; zero-use months stay zero. Roof area, collection efficiency, starting storage and rainfall remain unchanged. No additional NASA request is needed for these comparisons.
After the first successful tank comparison, valid calculator edits update the results automatically using the same daily rainfall and simulation in your browser. Invalid or unfinished inputs hide the old result until corrected. Choosing a different location or history period loads that period's rainfall before updating. The daily record stays in page memory and is not placed in share links or browser storage.
The sensitivity table reports coverage and longest shortfall for the tank highlighted in the normal result. It also shows the near-plateau size separately selected within each case. The normal result is unchanged. These are illustrative scenario variations, not a probability model, forecast, confidence interval or purchase recommendation. A case outside the supported water-use range is shown as unavailable rather than silently clipped. The sensitivity CSV contains all tested tank sizes in each available case and always uses litres and m²; the printable summary includes the comparison.
Quick roof presets are explicitly estimated rectangular footprints of 30, 80, 120 and 200 m². They are starting assumptions, not observed averages or measured connected catchments. The estimate label accompanies the on-page result, printable summary and shared scenario. The water-use sensitivity test does not vary roof area: compare other areas separately when the catchment is uncertain.
Garden watering check
The separate garden-watering helper uses your entered stored water, reserve and steady daily use to count full watering days without crediting new rain or top-ups. It also shows an illustrative 25% increase in use. It does not predict plant demand.
After the first valid water check, edits update this budget automatically in the browser. The optional refill comparison also updates locally using its loaded forecast while that forecast remains current. Changing the forecast location or using expired weather requires another explicit weather check; input edits do not silently request new weather.
For the entered period, it calculates the starting fill needed while retaining the reserve. If even a full tank is too small, it shows the capacity required when starting full. It cannot allocate usable water when the reserve is 100%. These volume checks do not recommend a purchase or predict refills.
Its gravity check uses fresh-water static head: pressure in bar = water-surface height above the emitters in metres × 0.0980665. It checks the current and planned refill heights against an optional equipment-label minimum. These are pressure ceilings before hose, filter, fitting, valve and emitter losses, not delivered flow or installation approval. Volume is not converted to water height because tank geometry is not entered. A low-water failure can require refilling sooner than the volume budget suggests.
When a positive kit minimum is entered, the helper also divides it by 0.0980665 to show the theoretical minimum water-surface height and any shortfall at refill level. Flowing-system losses require additional head. This does not design a raised stand or specify a pump. Minimum fill, capacity and height figures round up for display.
A user-entered measured delivery rate can calculate daily run time. Use the whole setup's delivery at its refill level, not unrestricted tap flow, and test individual plants and the furthest emitter. The helper does not size pumps or certify equipment compatibility.
Next-rain refill forecast
The garden helper’s next-rain refill check compares projected stored water with and without forecast rain. It uses MET Norway’s Locationforecast for a place you choose. Complete, contiguous one-hour intervals are used first, followed by six-hour intervals where available, without overlapping precipitation totals. The chart shows the actual period, up to five days, and forecasts with fewer than three complete days or data issued more than 12 hours ago are unavailable. There is no silent substitute for missing rain data.
Forecast collection (L) = liquid rainfall (mm) × connected roof footprint (m²) × collection efficiency
Starting fill is assumed at the next complete forecast hour, the chart's start. Rain is spread evenly by hour within each source interval. At each hour, the model adds collection, caps storage at tank capacity and records overflow, then supplies one twenty-fourth of the entered daily use from water above the reserve. Unmet use is recorded and does not become a debt to draw from later rain. The no-new-rain trace uses identical inputs and timing with collection set to zero. Stored water can remain below the reserve if it starts there; the model never invents water to reach it.
MET precipitation may include snow. Snow or sleet symbols, air temperatures or period minimum temperatures at or below 1°C, and unavailable temperature data prevent precipitation in that interval from being credited as refill. This conservative filter does not model snowmelt, frozen stored water or frozen plumbing. Total forecast precipitation and excluded amounts remain visible.
Forecast rain is an estimate for an area, not a roof gauge reading or refill guarantee. Rainfall timing, daily use, losses and local weather can differ. The chart uses the browser's named time zone; this may differ from the selected place. Starting fill and steady daily use must be reviewed when returning. Keep an alternative water supply where a shortfall matters. This forecast is separate from NASA’s historical tank-size simulation and does not alter it.
Forecast data: MET Norway, under CC BY 4.0. Rain Tank Planner selects intervals, filters cold precipitation and models collection and storage as described above. See the source data model and licence information. MET Norway does not endorse this tool.
Water-flow illustration
The homepage illustration uses the calculator's first entered tank size, connected roof area, collection efficiency, starting fill and daily water-use amount. It updates locally when these values, presets or units change, keeping the current day and any manual pause. Its controls stay Garden, Home, Both and pause. It reuses the selected location's NASA POWER daily history already loaded for the calculator, without another weather request for input edits.
The picture chooses the current calendar month in your browser. If seasonal water use is enabled and this month is inactive, it chooses the next checked active month. For that calendar month, it compares every complete recorded month in the selected history, calculates their mean total precipitation, and chooses the actual month whose total is closest to that mean. Ties use the most recent year. Its original daily sequence is retained, including dry spells and the real 28–31 day month length. At least two complete matching months are required; missing days never become zero rain.
The compact label identifies the typical month and NASA source. The accessible caption and label tooltip identify the chosen historical year, available sample period and source grid point. “Typical” refers only to the monthly total being near the historical mean: the chosen month is one recorded sequence, not a composite, forecast, guarantee or drought test. A total near the mean does not ensure typical dry-spell lengths or reliable supply. The annual comparison still uses the full selected history to assess tank sizes.
While a new location loads, or its coordinates are invalid, playback pauses; an earlier location's history is never labelled as the new location. If daily NASA history is unavailable or a local-file example is selected, the picture explicitly switches to example weather. That 30-day Mixed example assigns rain to days 3, 7, 8, 14, 20, 21 and 27: 6, 12, 4, 8, 10, 3 and 7 mm (50 mm total). A new rainfall source or selected month starts at day zero while retaining a manual pause.
Each daily step adds collected water, spills above capacity, then draws available water. NASA's small positive precipitation amounts are retained in full for collection. For the historical illustration only, the rain symbol and skipped Garden use apply at 1 mm/day or more; smaller amounts use the dry-day symbol and entered Garden use while still contributing refill. This is a display and demand assumption, not a claim that 1 mm meets a garden's needs. Symbols do not reproduce observed cloud cover. NASA grid precipitation is treated as liquid roof runoff in this schematic; snow, freezing and delayed snowmelt are not modelled. Collection and withdrawal appear in separate display phases.
On the homepage, Garden uses the whole entered daily amount on dry days and rests on rainy days. Home uses the whole daily amount each day for the non-potable home example. Both splits the entered total equally between Home and Garden: for example, 100 L/day becomes 50 L Home plus 50 L Garden on dry days, and only 50 L Home on rainy days. Home is supplied first when water is scarce; garden use gets the water left. No extra reserve is deducted because the main calculator has no reserve input. Branches light only for water actually supplied.
An empty active-month selection pauses the picture until corrected. Skipping wet-day Garden use is a simple visual rule, not a soil-moisture model. The annual tank-sizing calculation retains its entered-use schedule on wet days, and the real MET no-new-rain comparison retains identical demand on both traces. The rain-barrel introduction remains a fixed synthetic Garden example: 500 L capacity, 50% starting fill, 10% reserve, 80 m² of roof, 80% collection and 50 L per dry day. Both introductory pictures run at two seconds per illustrated day.
Choosing Garden, Home or Both changes only how the picture applies the entered amount; it does not overwrite calculator fields. Blank or invalid inputs pause and dim the last valid picture, disable playback and show a short message. Purpose selection can still compare the last validated setup while paused; valid corrections resume unless you paused manually. No missing field is silently replaced with an example number.
Autoplay runs only while visible, pauses when hidden, and is disabled by reduced-motion preferences; purpose selection still works on the enhanced static picture. Failed enhancement keeps the original static diagram and explicitly says it cannot reflect calculator values. The calculator's historical sizing, no-new-rain budget and MET comparison keep their own data and calculations.
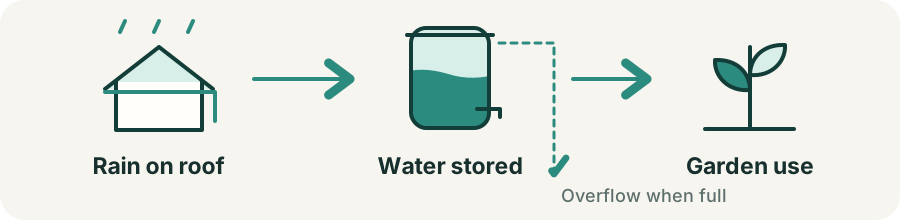
The pictures retain the model's exact daily or hourly checkpoints and reserve. Between checkpoints, collected water fills the tank before excess water leaves its upper overflow outlet; withdrawal then lowers the tank. These display phases explain the model's order, not the timing of rain or use within an actual day or hour. Overflow flows only while the visible tank is full, and garden watering is separate from the overflow outlet.
The optional forecast picture keeps the same hourly model points and real forecast range as the water-level chart. Rain/no-new-rain controls change its displayed trace without another weather request. Playback starts only when requested, pauses when the scene is hidden, and is disabled when the browser requests reduced motion. These pictures are schematics; their shapes and piping do not establish tank geometry, pressure, installation or plant needs.
5. NASA POWER source
The default source is corrected daily precipitation (PRECTOTCORR) from the NASA POWER Daily API. The planner requests completed calendar years, rounds coordinates to the meteorology grid to avoid duplicate requests, and caches the public grid-period response on the application server for up to 30 days. Exact submitted coordinates are not written into that cache. The source response records the underlying dataset, API version, units, source grid point, period, and access time.
NASA POWER describes daily data as available from 1981 to near real time. Its service documentation also warns applications not to request the same underlying grid cell repeatedly. NASA's precipitation validation shows that agreement with station observations improves as values are aggregated beyond one day. That is why the product compares long historical sequences and lets users provide local daily data; it must not portray an individual modeled day as a gauge measurement at the roof.
Primary references
- U.S. DOE FEMP Rainwater Harvesting Systems Technology Review
- U.S. DOE FEMP Rainwater Harvesting Calculator
- NASA POWER Daily API
- NASA POWER precipitation methodology and validation
- NASA POWER referencing guide
- NASA Earthdata data-use and citation guidance
Monthly climate chart
NASA calculations also request daily maximum and minimum air temperature at two metres (T2M_MAX and T2M_MIN) for the same grid point and years. The chart averages complete monthly precipitation totals across years. Temperature lines average each complete month's daily highs or lows, then average those monthly means across years. They are typical historical daily highs and lows, not record extremes or a forecast. Missing or invalid records exclude that month-year; the monthly-values table shows how many years contribute to each measure.
Selecting a location shows these twelve monthly averages before a tank comparison is needed. The history period is shown above the chart. A local CSV does not supply the NASA temperature summary.
Metric displays use °C and mm; US displays use °F and inches. Temperatures are shown for context and do not change the tank model. CSV calculations have no NASA temperature chart.
6. Safety and scope
The historical tank-sizing model covers non-potable preliminary storage questions only. It does not assess drinking-water treatment, roof contaminants, tank materials, backflow prevention, mosquito control, freezing, structural loads, burial, pumps, pressure, drainage, overflow routing, fire reserves, permits, rebates, water rights, or local plumbing codes. The separate garden helper estimates static gravity pressure as described above. Check local rules and use qualified professionals before purchasing or installing a system.